
This information is Issued for Puerto Rico and the Virgin Islands.For more information visit your corresponding Seismological Institution or theTsunami Warning Centers
| Event Details | |
|---|---|
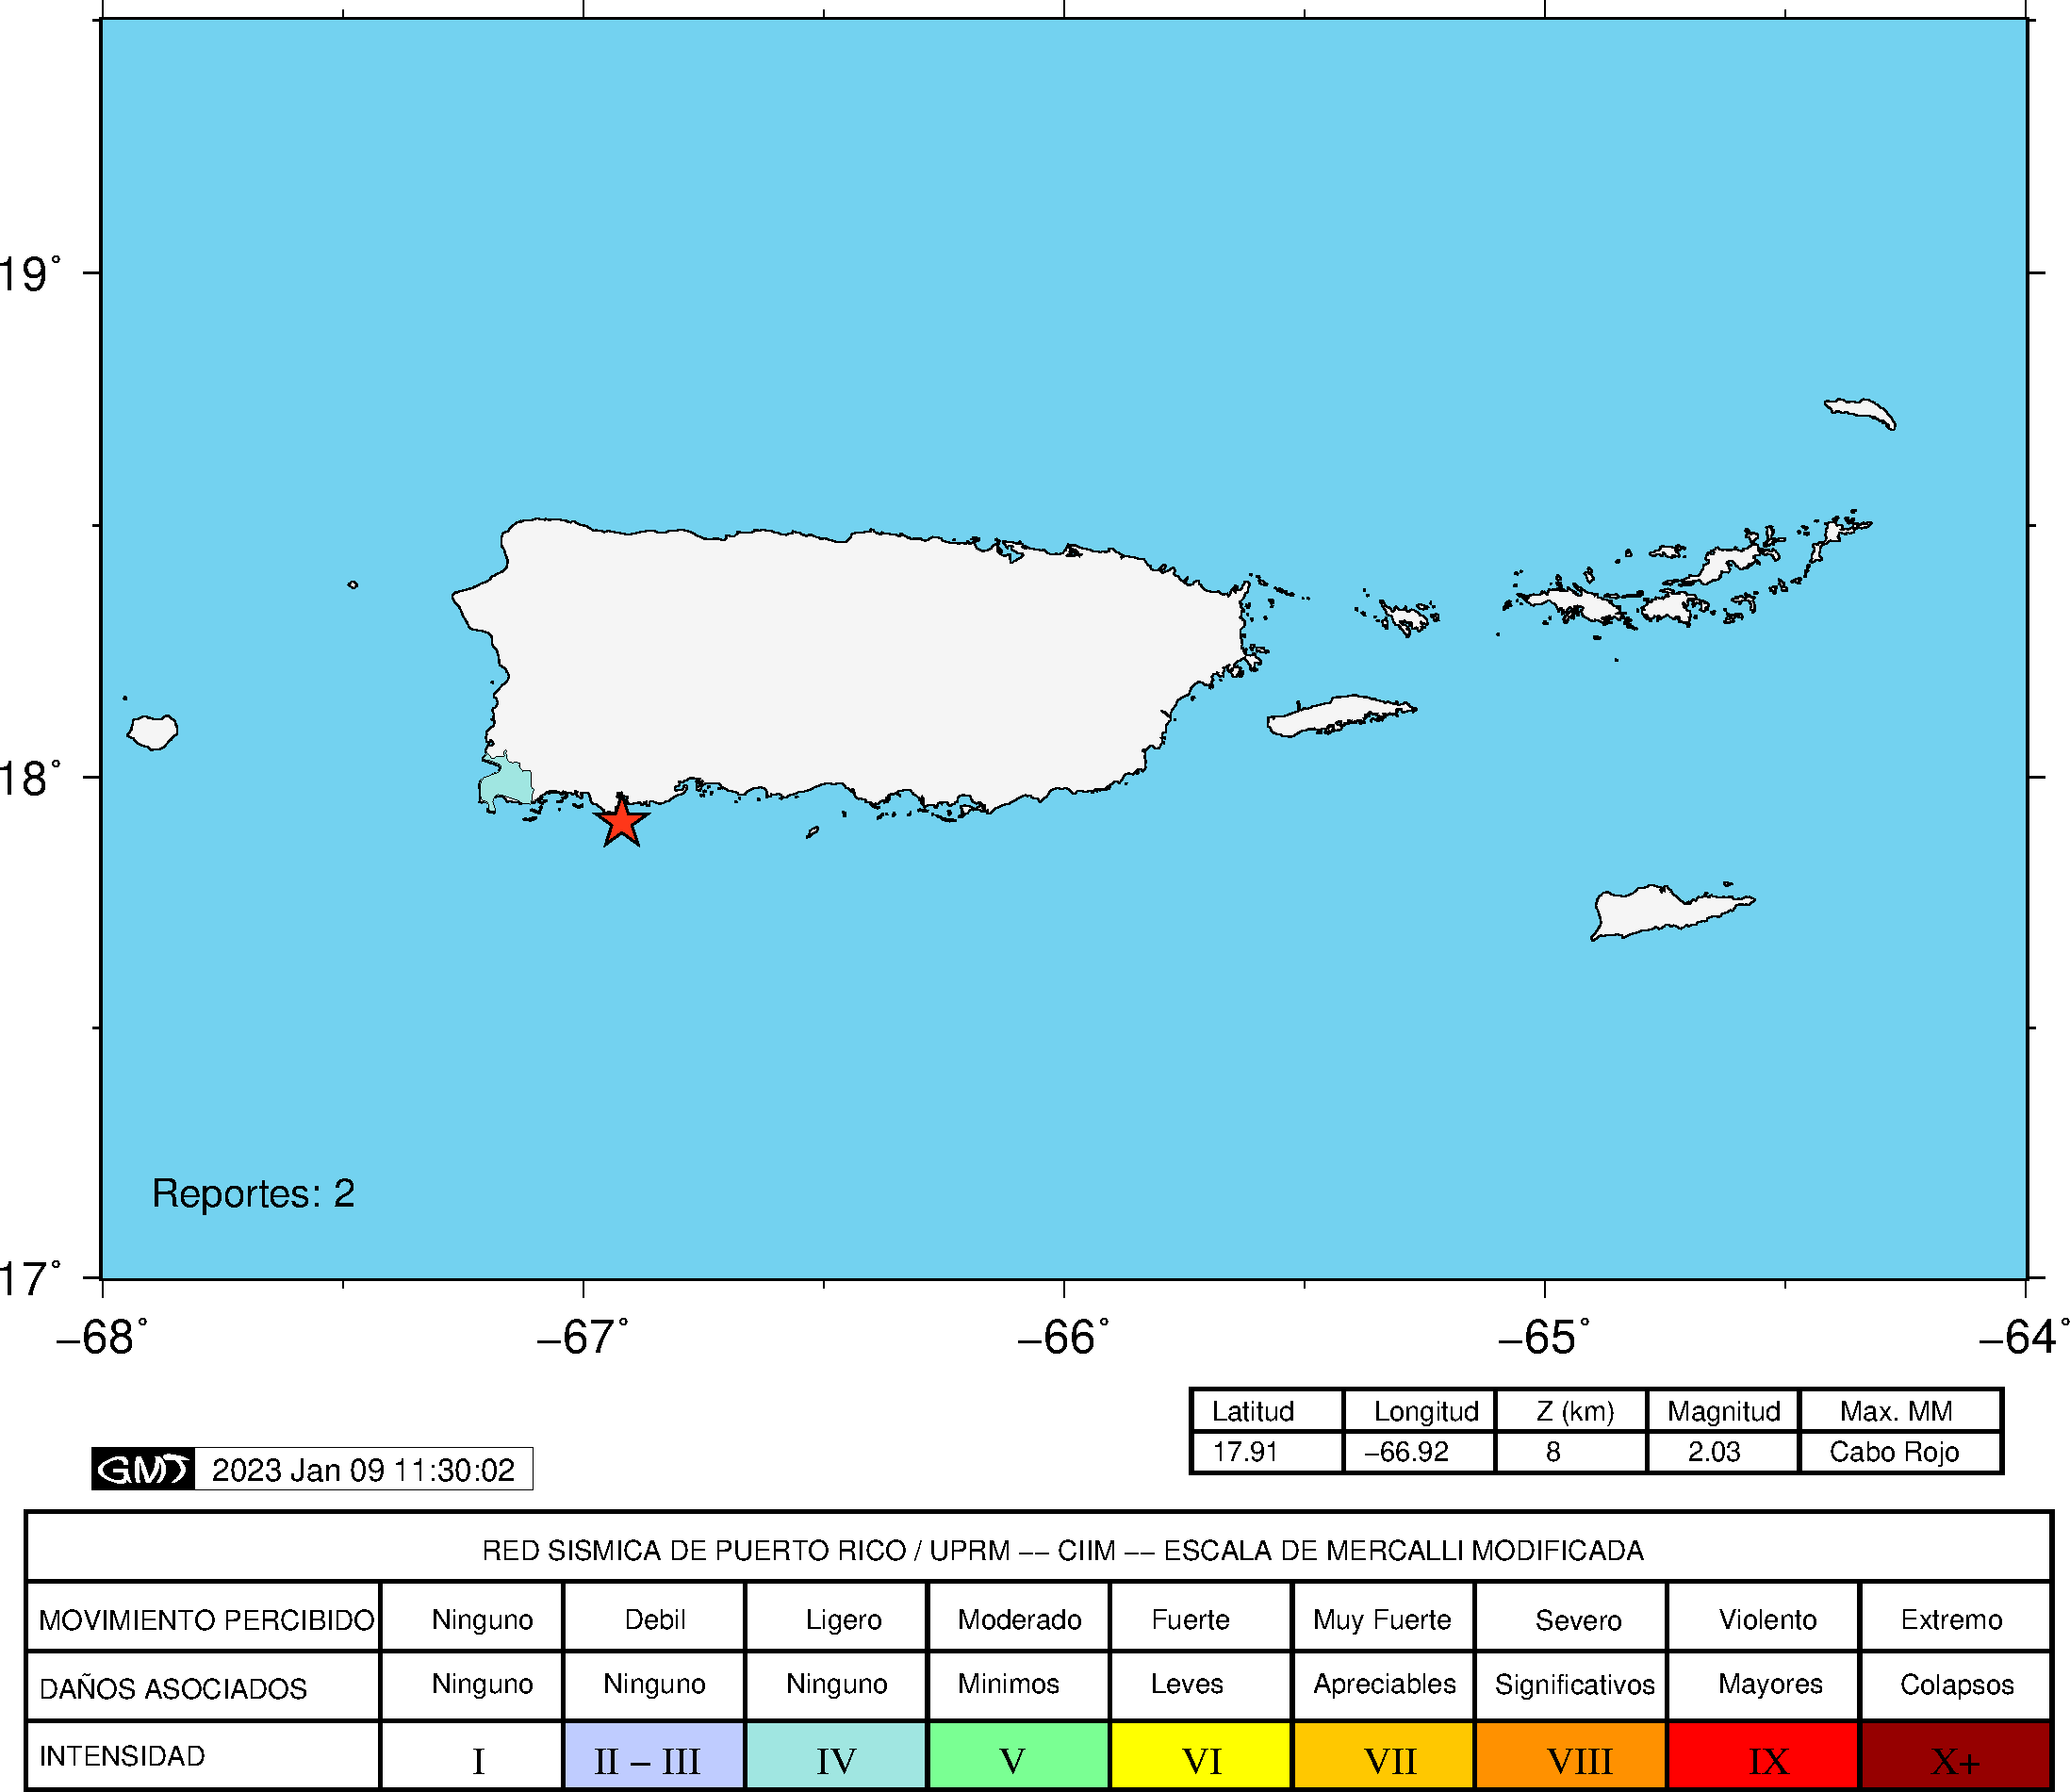
| Estimated Maximum Intensity: | II in Cabo Rojo, PR |
| Date: |
January 09, 2023 10:19:06 UTC January 09, 2023 06:19:06 Hora Local |
| Region: | Southern Puerto Rico |
| Distances: |
8.83 Km South of Guánica,PR 17.44 Km Southeast of Lajas,PR 37.87 Km West-Southeast of Ponce,PR |
| Magnitude: | 2.03 Md |
| Location: | Latitude: 17.9105 Longitude: -66.9213 |
| Depth: | 8 Km |
| Tsunami Warning Level: | No Warning, Advisory or Watch is in effect for Puerto Rico and the Virgin Islands |
| Issued Date & Time | 2023-01-09 07:09:53 |
| ID: | 20230109101900 |
Epicentral Map
| BULLETIN 1 Seismic Event/Tsunami |
|
|---|---|
| DATE: | January 09, 2023 |
| LOCAL TIME: | 06:19:06 |
| LATITUDE: | 17.9105 N |
| LONGITUDE: | 66.9213 W |
| LOCATION: |
8.8 Km South of Guánica,PR
37.9 Km West-Southeast of Ponce,PR |
| DEPTH: | 8 Km |
| MAGNITUDE: | 2.03 Md |
| ESTIMATED MAXIMUM INTENSITY: | II in Cabo Rojo, PR |
| TSUNAMI ALERT LEVEL: | No Warning, Advisory or Watch is in effect for Puerto Rico and the Virgin Islands |
| DATE & ISSUED TIME | 2023-01-09 07:10:02 |
|
The Puerto Rico Seismic Network (PRSN) received information that this
micro earthquake was reported as
felt in Cabo Rojo with a maximum
intensity of II (Modified Mercalli Scale, MM).
At the moment of generating this bulletin no damages has been reported, but given the size and location this can not be ruled out Based on magnitude, location and historic records the earthquake was not sufficient to generate a destructive tsunami to Puerto Rico and Virgin Islands. |
|

|
|
Technical Information
YEAR MO DA  --ORIGIN--  --LAT N-  --LON W--  DEPTH   RMS   ERH   ERZ  XMAG  FMAG  PMAG  INT
2023-01-09  1019  6.90  17 54.63   66 55.28   8.59  0.07  1.01  1.60        2.03  2.03D II
                                                                                         SOURCE
NSTA NPHS  DMIN MODEL GAP ITR NFM NWR NWS NVR REMRKS-AVH  N.XMG-XMMAD-T   N.FMG-FMMAD-T  L F X
   8    8   8.4  PR1  266  14   4   7   3   8     Q  PPX   0.00  0.00      3.00  0.17 D

XMAG2-N.XMG2-XMMAD-T-S  FMAG2-N.FMG2-FMMAD-T-S  PREF.MAG-N.PMAG-PRMAD-T
                         2.03   3.00  0.17 Z        2.03   3.00  0.17 D

REGION= South of Puerto Rico

STA NET COM CR DIST AZM  AN P/S WT   SEC (TOBS -TCAL -DLY  =RES)  WT   SR  INFO  CAL DUR-W-FMAG-T -AMP-U-PER-W-XMAG-T
GBPR PR HHZ  A  8.4  31 121 IPU     9.20  2.30  2.29 0.00  0.01  1.56     0.725
GBPR PR HH1  A  8.4  31 121 ES  1  10.95  4.05  4.08 0.00 -0.03  0.78S    0.631
MLPR PR HHZ  A 14.6 297  98 EP- 1  10.26  3.36  3.18 0.00  0.18  0.78     0.289 0.55  17   1.83 Z
MLPR PR HH2  A 14.6 297  98 ES  1  12.46  5.56  5.66 0.00 -0.10  0.78S    0.758
CRPR PR HHZ  A 22.6 299  92 EP+ 1  11.32  4.42  4.42 0.00  0.00  0.78     0.245 0.55  20   2.03 Z
CRPR PR HH2  A 22.6 299  92 ES  1  14.40  7.50  7.87 0.00 -0.37  0.00S    0.000
LSP  PR HHZ  A 34.1 330  91 IPD    13.04  6.14  6.19 0.00 -0.05  1.56     0.691 0.58  23   2.20 Z
LSP  PR HH1  A 34.1 330  91 ES  1  18.04 11.14 11.02 0.00  0.12  0.78S    0.658
Event Maps
 Spectral Acceleration |
 Intensity Map |
 Peak Ground Velocity |
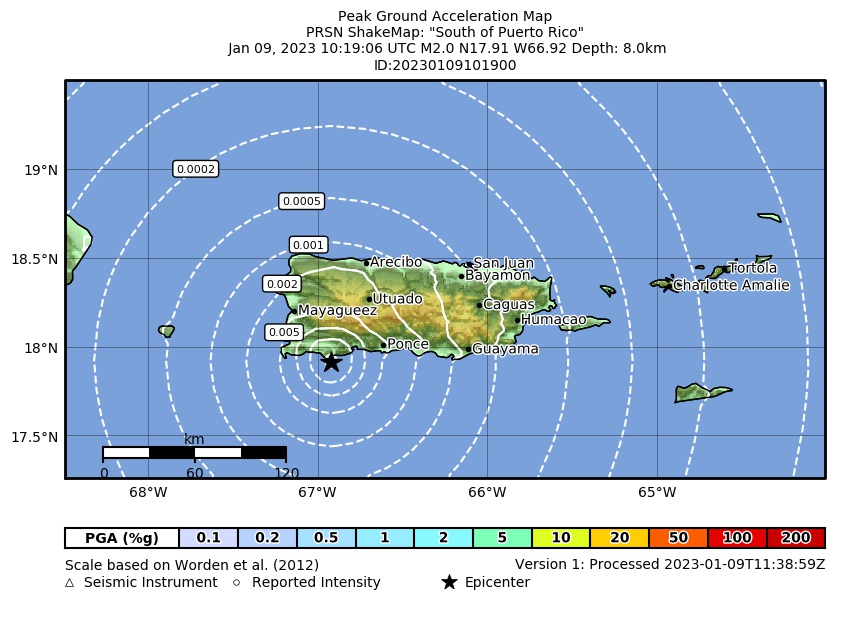 Peak Ground Acceleration |
 DYFI Map |
Google Map for this Event |